

A school's acceptance rate tells you how hard it is to get in. It doesn't tell you how the decision actually gets made. Behind every admit and deny letter sits a process built on a few things you can influence, like your transcript and your activities, and a few things you can't, like a college's enrollment targets for that year. This article breaks down both sides, so you know what you're really being measured against.
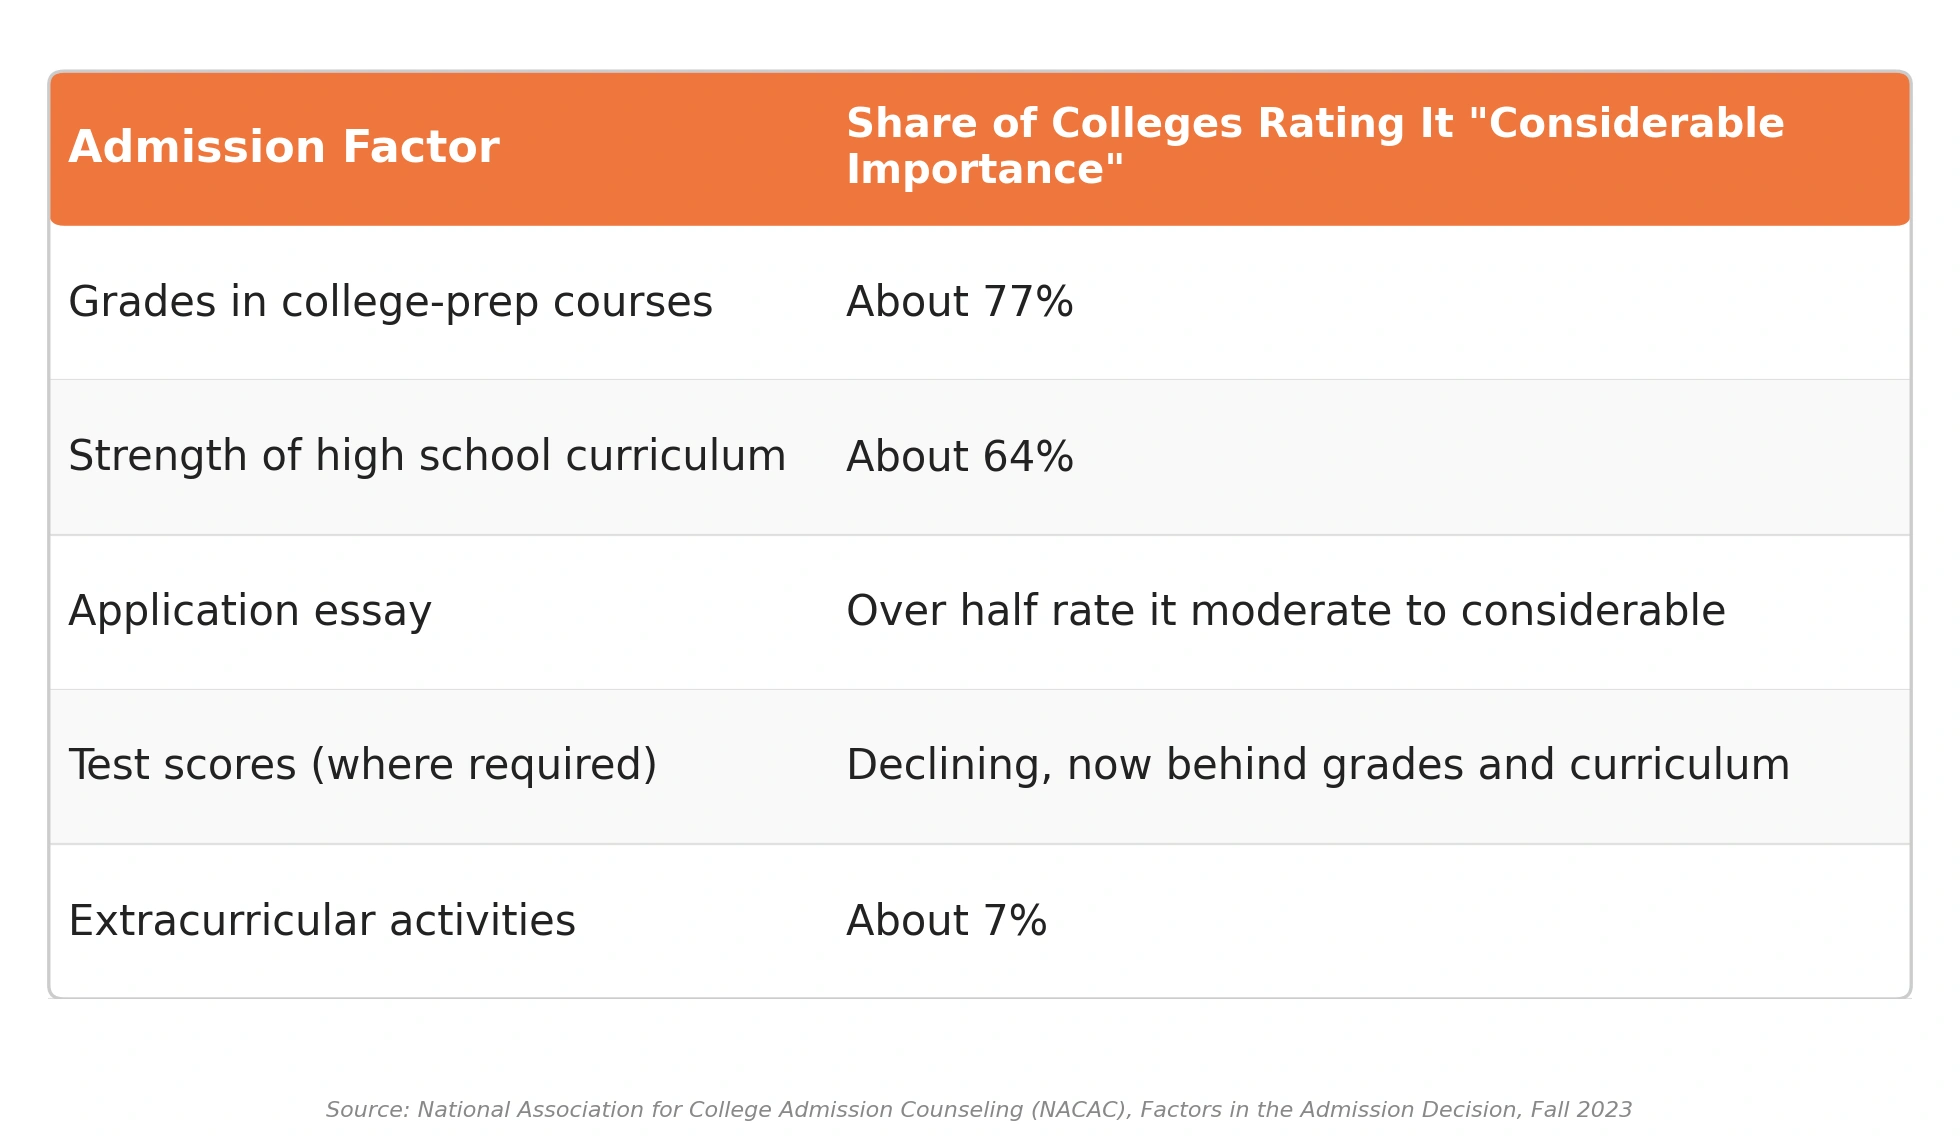
Survey data from the National Association for College Admission Counseling shows a clear ranking: grades in college-prep courses top the list at about 77 percent of colleges calling them a considerable factor, followed by strength of curriculum at about 64 percent, then the essay, then test scores, with extracurricular activities trailing at about 7 percent.
Course Rigor, School Profiles, and Recalculated GPA
Grades and course rigor sit at the top of that ranking for a reason. The National Association for College Admission Counseling, or NACAC, has tracked this pattern for over a decade in its own admission factors report: colleges trust your classroom record more than any single test score or essay. It's the clearest evidence of how you'll handle college-level work.
But your GPA doesn't travel alone. Your transcript arrives with a school profile, a document that tells the reader what grading scale your school uses, which AP or honors courses were actually offered, and how your class is generally structured. Without it, a 3.7 means nothing. With it, that same 3.7 might read as a near-maximum effort at a school with a limited course catalog, or as a middle-of-the-road result at a school offering twenty AP classes.
That's also why colleges often recalculate your GPA instead of using the number your school sends. Many convert everything to an unweighted 4.0 scale, count only core academic subjects, and add their own rigor points for AP, IB, or honors courses. This varies by institution, so the number on your transcript and the number in your file can end up meaningfully different. Scholaro's own breakdown of how GPA conversion works walks through why two evaluators can start from the same grades and land on different numbers. If a student took four AP classes at a school offering ten, for example, that reads differently than four AP classes at a school offering two, and recalculation is how colleges try to capture that difference.
One private university has published its own version of this: a point system that revises GPA onto its own scale, drops freshman year, and excludes non-core classes like PE. It's not the only school doing this, but it's a useful illustration of how much a formula can reshape the number you thought defined you.
Inside the Admissions Office's First Read
Here's the part that surprises most applicants. At many highly selective schools, the first read of your full application can take as little as four to eight minutes. The Chronicle of Higher Education has covered this directly in an eight-minute read, reporting on a wave of colleges, including the University of Pennsylvania, that have shifted to a faster, two-reader review model. Other schools still take closer to 20 minutes per file under a more traditional single-reader approach. Either way, most readers move in a fixed order: academic index first, so grades and test scores, then your activities list, then your essay.
That compressed timeline changes what actually works in your activities list. A packed list of ten shallow memberships doesn't hold up under a fast read the way one sustained, specific commitment does. Many counselors informally sort activities into rough tiers, from national-level achievement down to general participation, and the pattern that shows up again and again favors depth over volume.
This is also where extracurriculars land in the bigger picture. NACAC's data puts them well behind grades, curriculum, and even essays in most colleges' stated priorities. They're not a top factor. What they do is add color and consistency to a file that's already cleared the academic bar. They rarely save a weak transcript, but they can separate two similarly strong ones.
How Yield and Institutional Priorities Shape a Class
Not every decision in that file comes down to you. Colleges track yield, the share of admitted students who actually enroll, and it shapes who gets in more than most applicants realize. In fall 2022, the average yield rate across four-year colleges was just over 30 percent, running higher at private colleges than public ones, according to NACAC's yield rate data. A school with a shaky yield rate has to admit more students than it has room for, then hope enough of them decline so the class doesn't overflow. That guesswork pushes some offices toward applicants who've signaled they're likely to say yes.
Layered on top of that are institutional priorities that have nothing to do with your file's quality. A college might need more students in its engineering program that year, or more geographic spread, or a specific number of recruited athletes. If a student has a strong application but applies into a major that's already full, for example, that seat problem can outweigh a solid transcript. None of this gets published anywhere. It just sits behind the acceptance letter.
How Early Decision Affects Your Acceptance Odds
Application timing plugs directly into that yield problem, which is why early decision and early action programs exist, and why they behave so differently from each other. Early decision is binding: if you're admitted, you're contractually committed to enroll, which hands a college a guaranteed yield on every seat filled that way. Early action carries no such promise, since accepted students stay free to apply and enroll elsewhere.
That difference in commitment shows up clearly in early decision admissions data, NACAC's most recent published breakdown by application round: colleges offering early decision admitted early applicants at an average rate of about 62 percent, compared with roughly 51 percent in their regular round, and colleges offering early action showed a similar pattern, admitting about 74 percent of early applicants versus 64 percent overall. At more selective private colleges specifically, the gap between early decision and regular decision tends to run even wider than that average, often two to three times as large, largely because of the binding guarantee and the recruited-athlete pools that tend to apply early.
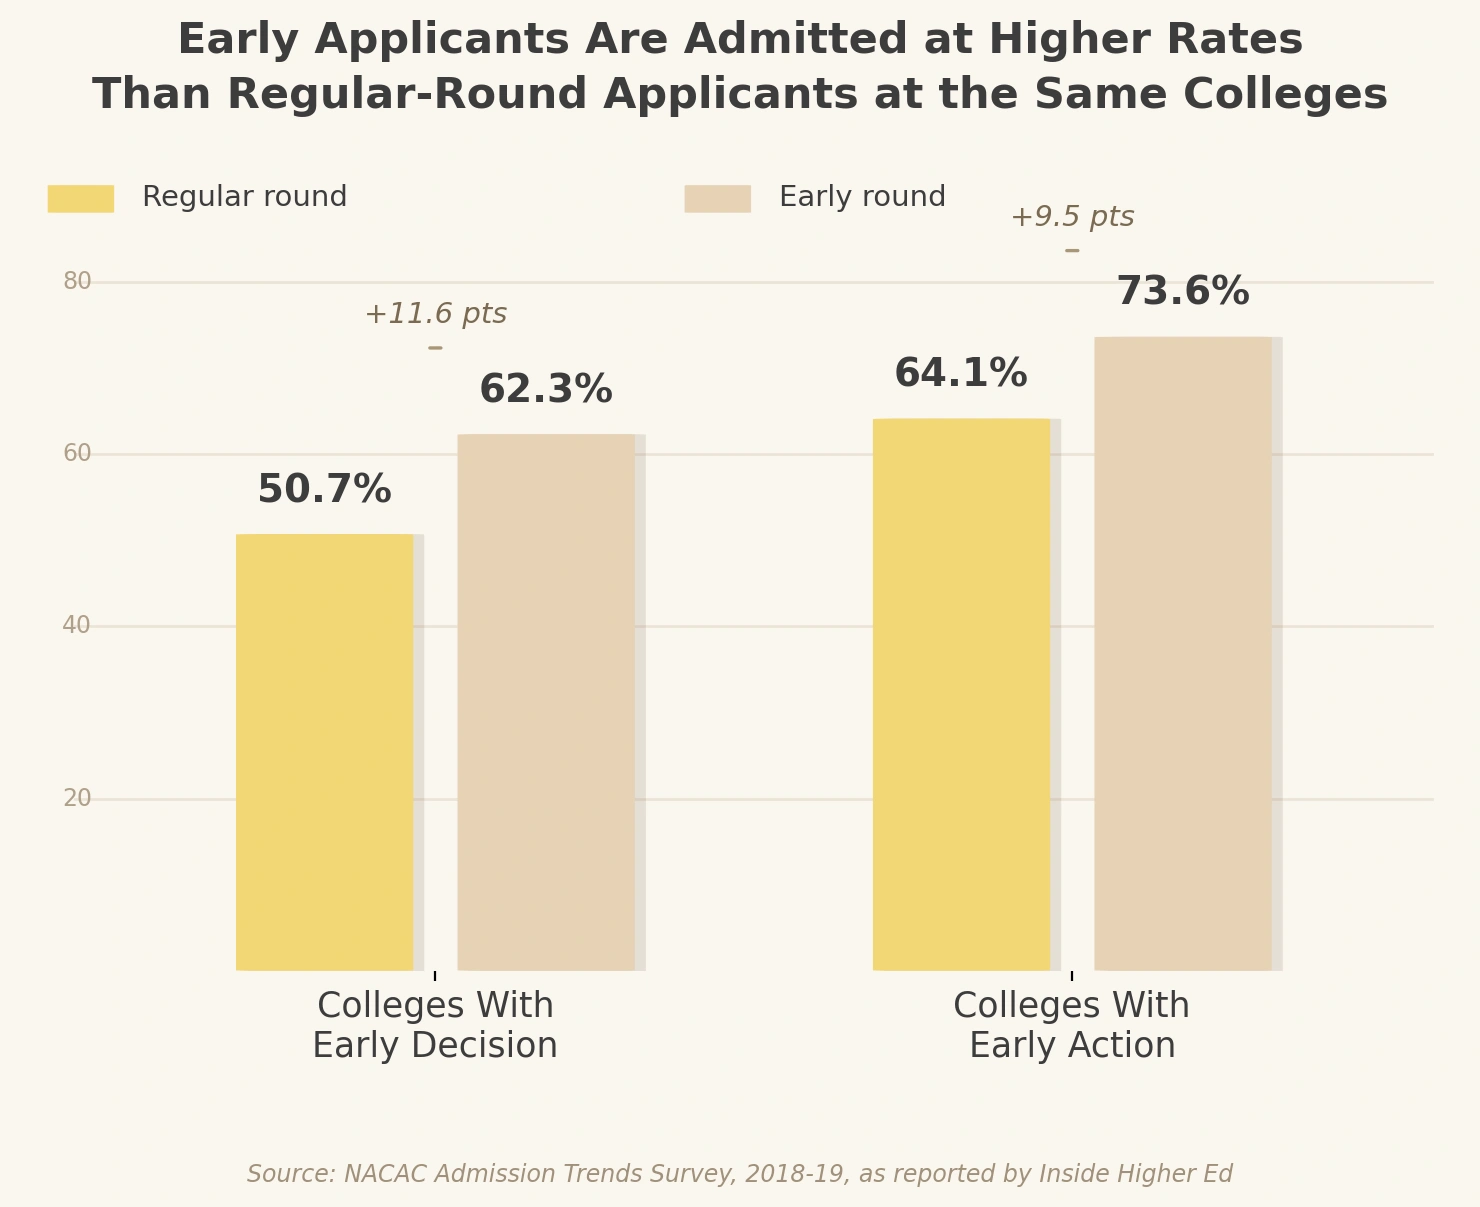
The gap isn't a guarantee everywhere. Some of it comes from who applies in each round. Early pools often include recruited athletes and highly prepared applicants who were ready to apply months ahead of the regular deadline, which would lift admit rates in that round regardless of the binding commitment. A few highly selective schools, including Princeton, state directly that applying early carries no admissions advantage at their institution. The honest read is that early decision's structural advantage is well documented at most schools that offer it, but the size of that advantage varies enough from one college to the next that it's worth checking a specific school's own numbers before treating it as a shortcut.
Putting the Admissions Factors Together
None of these factors work in isolation. Your grades and course rigor set the floor. Your activities and essay add texture once you've cleared it. Yield, institutional need, and application timing decide the rest, and most of that happens without your name attached to it. Understanding which lever you're actually pulling, at any point in the process, is the real advantage over just watching the acceptance rate.
 How Leveraging Job Placement Strategies Can Reenroll Returning Students
 How Universities Can Guide Top Students Beyond Corporate Career Tracks
 How Global Education Hubs Are Redefining University Expansion Strategy
 Why Colleges Need Brand New AI Majors
 The Financial Crisis Shrinking Small Colleges