Grade inflation isn't a rumor old professors made up because they miss the "good old days." It's real, it's measured, and in 2026 the data makes it hard to argue with. GPAs have been climbing for decades while what those grades actually mean keeps shrinking.

Here's the picture at a glance:
Metric | Then | Now |
|---|---|---|
National average college GPA | 2.81 (1990) | 3.15 (2020) |
Harvard grades that are A's | About a quarter (2005) | 60% (2024-25) |
Yale grades that are A or A-minus | Not tracked the same way | About 80% (2022-23) |
Employers who screen by GPA | 73% (2019) | Under 50% (2025) |
How High Have GPAs Actually Climbed
Here's what the data actually shows:
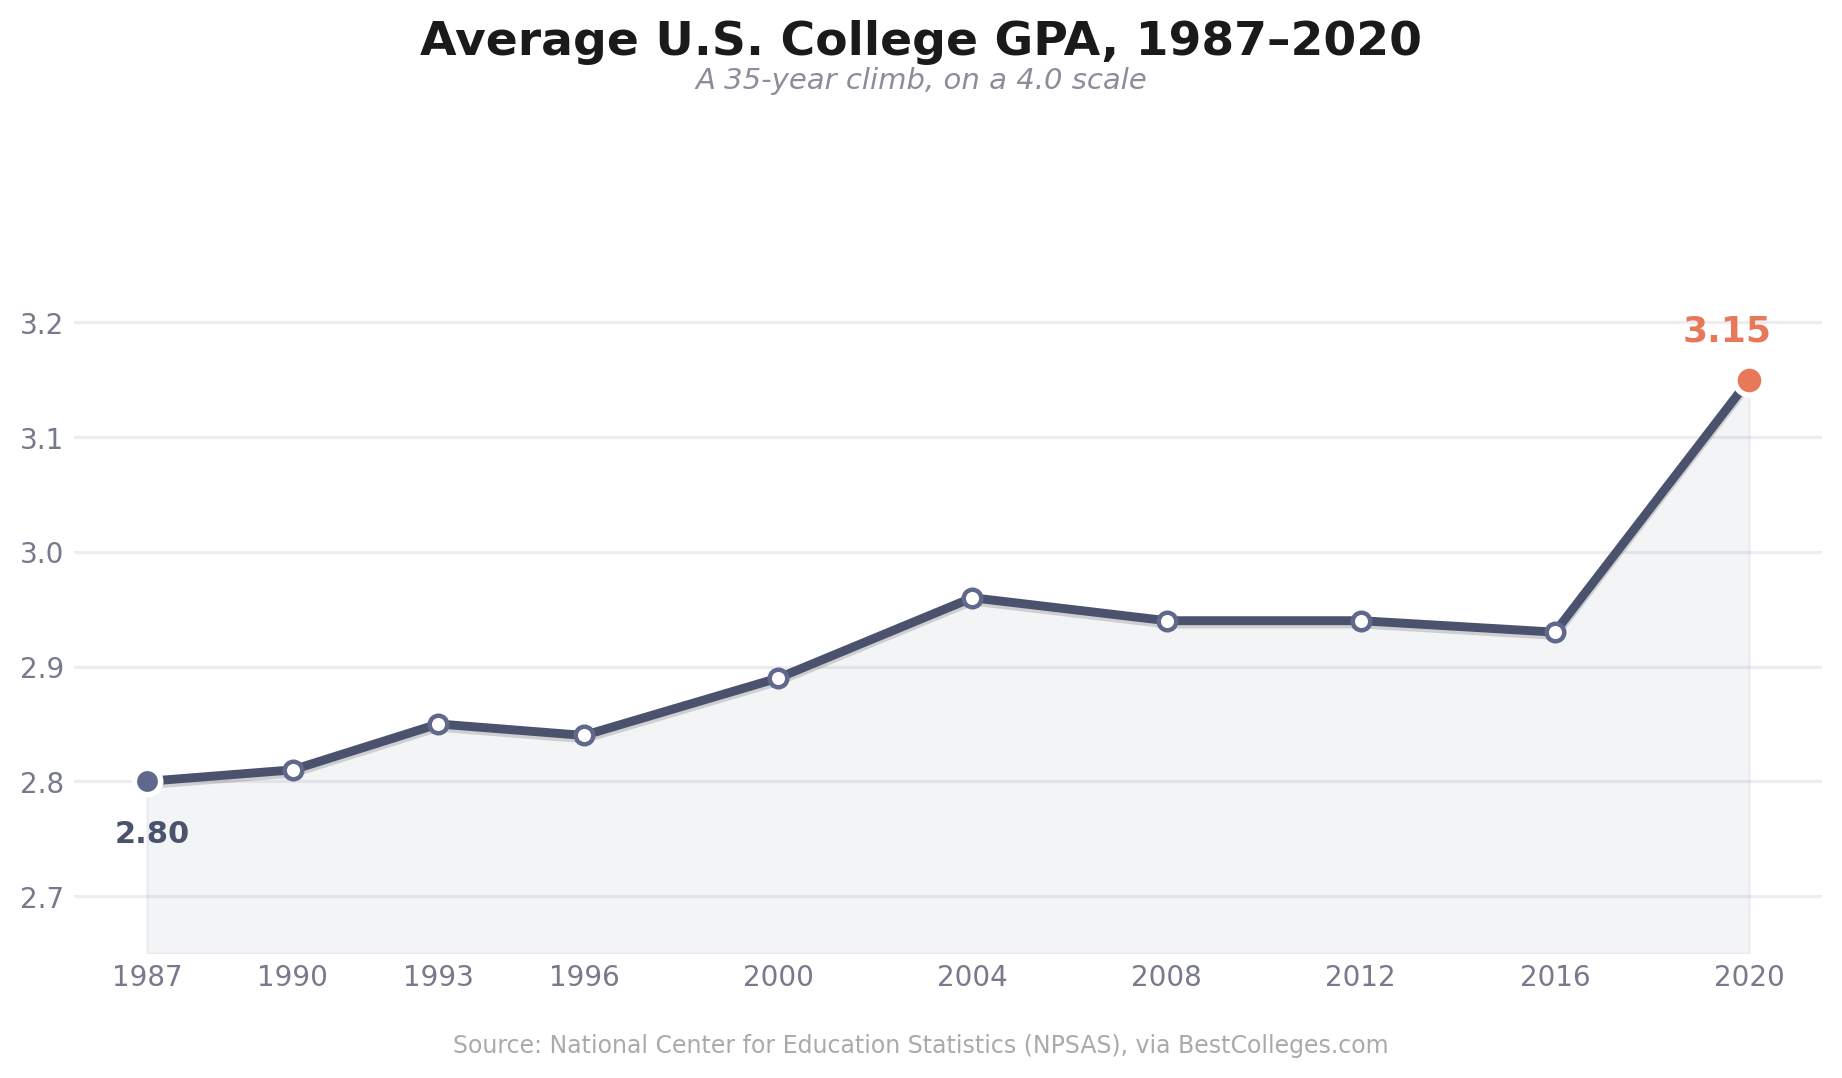
The average college GPA in the US went from 2.81 in 1990 to 3.15 in 2020, per NCES data reported in this GPA data breakdown.
At Harvard, 60% of all grades handed out in 2024-25 were A's. Two decades ago it was about a quarter. That's a jump of roughly 150%, according to the Harvard Crimson report.
Yale's mean GPA hit 3.70 in 2022-23, with about 80% of grades landing as A or A-minus, per the grade inflation report.
Graduate school has the same problem. A 2026 study tracked 40,516 graduate students over 22 years and found grade inflation in both master's and doctoral programs, even after accounting for GRE scores. Read the PLOS One study.
If a student, for example, graduates with a 3.9 GPA today, that number doesn't narrow much down anymore. A hiring manager has probably interviewed twenty other students with the same GPA and wildly different skill levels.
What's Driving Grades Higher
Grades don't drift upward because professors got soft. The system pushes them that way.
Student surveys carry weight. Plenty of schools tie funding and faculty promotions to how happy students are in course evaluations. Students tend to rate classes higher when they get better grades, so professors feel the pressure to keep grades generous.
Nobody wants to grade alone. If other schools hand out easy A's and yours doesn't, your students look weaker next to everyone else's transcript. That pushes schools to keep pace instead of holding a line.
Why Parents Miss the Warning Signs
The biggest problem with inflated grades isn't that they lie. It's that they drown out a signal that used to work.
A 2026 Chicago paper found parents lean on grades a lot more than standardized test scores when deciding if their kid needs extra help.
When a child brings home a report card full of top marks but scores low on a standardized test, that's exactly the moment parents tend to relax instead of step in. The A's say everything's fine, even when the test score is waving a flag.
The Real Cost to Students and Employers
Research on students taught by lenient graders has found they're:
Less likely to pass the courses that come next
Scoring lower on standardized tests later on
Less likely to finish high school and enroll in college
Earning less later in their careers
Employers feel this too. A 2024 workforce report found 40% of employers think colleges aren't preparing students for the job. Separately, the share of employers who screen job applicants by GPA has dropped from 73% in 2019 to under 50% today, according to NACE hiring data. When the number on the transcript stops meaning anything consistent, employers stop leaning on it.
And that's the problem even when everyone is grading on the same broken scale. At least a US employer knows roughly what a 3.8 from an American university means this year, even if that meaning keeps shifting. Now stretch that same problem across borders. If a hiring manager or an admissions officer gets a transcript from a university overseas, they usually have no baseline at all for how that school grades, if A's are common there, or how the numbers compare to a US GPA. Domestic grade inflation makes reading a transcript harder. Reading a foreign one without any institutional context makes it close to guesswork.
This is the exact gap credential evaluation is built to close. A GPA from one country, translated onto a US scale, means very little without context on how grades are actually distributed at that specific school. Scholaro evaluates international transcripts against that missing context, so admissions offices and employers get a number that actually reflects the strength of the degree behind it instead of a raw score copied from a foreign scale.
Who's Actually Trying to Fix This
A few schools have tried. Princeton put a grade cap in place back in 2004, then dropped it in 2014 after years of complaints that it hurt students in job and grad school applications. Read the Princeton policy history.
Harvard's faculty just voted to cap A's at 20% of students per course, starting fall 2027, with a few extra A's left to a professor's judgment. See the Harvard grade cap vote. Plenty of Harvard students pushed back hard against the plan. Change like this doesn't come easy, even when the data backs it up.
Some analysts want the federal government to require every college that takes federal aid to publish an annual report on its grade distribution. Nothing like that exists yet on a national scale.
Read Grades With Context
If you're on the receiving end of a transcript, in an admissions office or on a hiring desk, a GPA on its own doesn't tell you much anymore. Ask for the grade distribution behind it, or get the institutional context evaluated, before you let one number decide anything.
 Strategies for Communicating Tuition and Outcomes to Prospective Students
 How Politics Is Shaping College Enrollment
 How Top Performers Land US Job Offers
 The College Majors Foreign Students Regret Choosing
 The Tightest Job Market in Years for College Grads