

Somewhere along the way, higher education picked up a dangerous habit: treating a low acceptance rate as proof of institutional quality. The underlying assumption? If you turn away most applicants, you must be doing something right.
But as we move through 2025, that illusion is crumbling. With university budgets shrinking, enrollment numbers declining, and a traditional college-age population projected to fall steadily over the next 15 years, clinging to exclusivity is a risk university leaders can no longer afford. Academic standards and student access are not natural enemies. The tension between them is mostly a myth, and it is one leaders cannot afford to keep believing.
The Myth That Access Lowers Standards
The argument goes like this: admit more students, especially from underprepared backgrounds, and you will have to water things down to help them pass. Faculty will get pressured to go easy. Grades will inflate. The degree will mean less.
The problem? Grade inflation is not happening at open-access institutions. Harvard's Office of Undergraduate Education reported that more than 60% of undergraduate grades were A's in the 2024-25 academic year, according to the Harvard grading report, up from just 25% two decades ago. That is a highly selective school. Selectivity does not protect rigor. It just protects the appearance of it.
To find true educational value, you have to look past the gatekeeping of admissions. The chart below illustrates how broad-access institutions frequently match or outperform highly selective universities on the metrics that matter most to long-term societal health: social mobility.
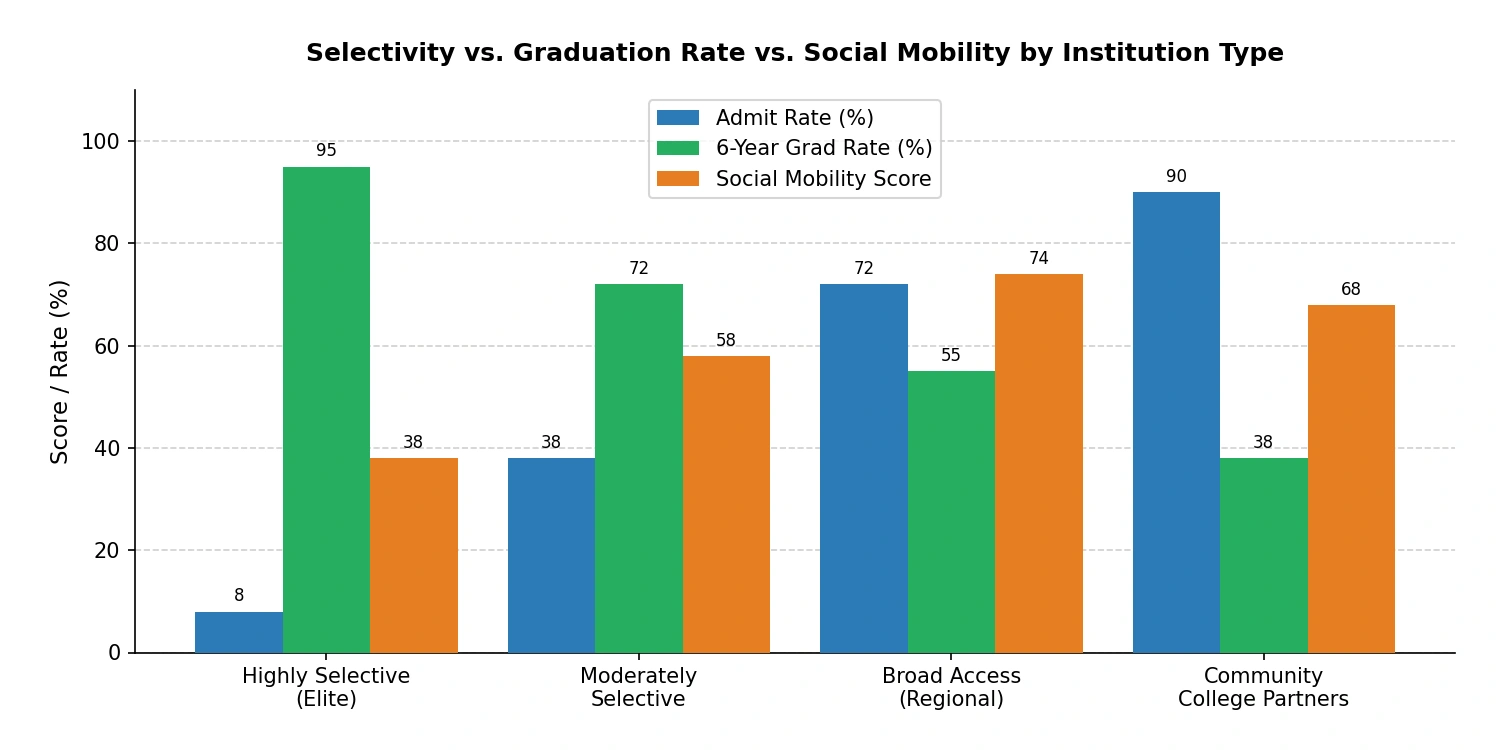
Broad-access institutions often outperform selective ones on social mobility, even when graduation rates are lower. The metrics tell a more complex story than admit rates alone.
The Pressures Leaders Are Facing Right Now
This is not just a philosophical debate. The conditions in 2025 have made it urgent.
Lawmakers in at least 15 states proposed or enacted public university funding cuts during 2025 legislative sessions, according to a Pew Charitable Trusts analysis.
New international student enrollment declined 17% in fall 2025, the largest nonpandemic drop in over a decade, according to the IIE Open Doors report.
The Western Interstate Commission for Higher Education projects the U.S. high school graduate population peaked in 2025, with steady declines forecast through 2041.
Evolving federal regulations and shifts in student aid eligibility have forced institutions to recalculate tuition discounting rates and financial aid models.
When the traditional student pipeline shrinks and budgets tighten at the same time, the pressure to admit more students from more diverse backgrounds becomes real. That is not a threat to standards. It is a prompt to rethink what maintaining them actually requires.
Take the situation many transfer students face: after arriving from a community college with strong grades and genuine motivation, spending the first semester in a writing center three times a week is not unusual. By year two, those same students are often tutoring classmates. They graduate on time. Admit standards did not drop to make that possible. The support infrastructure just had to do its job.
What Prestige Looks Like Now
The definition of a prestigious university has shifted. In 2019, U.S. News & World Report introduced social mobility into its national university rankings, giving schools credit for graduating Pell Grant recipients at high rates. The Social Mobility Index goes further, rating institutions on tuition control, low-income enrollment, and whether graduates land good jobs.
A university's standing built on a low acceptance rate is increasingly a liability in this environment. One built on outcomes is defensible to boards, donors, and accreditors alike.
Old Prestige Markers | New Prestige Markers |
|---|---|
Rejection rate | Graduation rate |
SAT score averages | Pell Grant recipient outcomes |
Alumni donations | Post-graduation employment rates |
Faculty research output | Social mobility index score |
Peer reputation score | First-generation student completion |
Rigor Without the Velvet Rope
Rigorous does not mean restrictive. Rigor is about what happens inside the classroom, not outside the admissions office.
Operationally, that means:
Clear learning outcomes tied to each program
Regular curriculum review cycles that respond to workforce shifts
Faculty accountability structures that do not punish instructors for teaching underprepared students
Accreditation compliance as a floor, not the ceiling
What Rigor Looks Like in the Age of AI
A high-standard curriculum in 2025 cannot simply be a legacy 2005 curriculum with an AI module bolted on. Rigor today means designing programs that develop durable, transferable skills that generative AI cannot easily replace. Leaders need to ask whether their programs are producing capabilities that hold up across roles and industries, not just credentials that reflect yesterday's job titles.
Deloitte 2026 trends report notes that institutions are actively rethinking their program arrays to align with a rapidly changing labor market. That is not dumbing things down. That is what rigor looks like when it is actually working.
Supporting Faculty Under Pressure
Faculty feel this tension too. When a large share of the class arrives underprepared, the path of least resistance is to simplify the material. Leaders who want to stop that from happening need to give instructors somewhere to redirect that pressure, not just tell them to hold the line.
That means investing in co-requisite support courses, early-alert systems that flag struggling students before mid-semester, and advisors with manageable caseloads. The problem is not that instructors lack standards. It is that they are being asked to solve a support problem inside a single course.
Access Is About Who Graduates, Not Who Gets In
Admitting a student and then leaving them without support is not access. It is a path to dropout.
The Pell Institute 2026 report confirms that students from the highest-income families earn bachelor's degrees at rates more than four times higher than students from the lowest-income families. The gap shows up in who finishes, not just who applies.
Consider what it takes for a working adult student to finish a degree while holding down a job. Taking one course per semester over six years is not unusual. Institutions that build flexible advising models, do not penalize part-time enrollment, and avoid resetting financial aid eligibility mid-program produce graduates from this group. Ones that do not, produce dropout statistics instead.
Community Colleges and Online Programs
Community college transfer pathways are not a brand risk. They are a quality-control mechanism. Students who complete two years of general education requirements at a community college arrive with demonstrated academic habits. Treating those partnerships as second-tier undermines both institutions.
Online programs carry the same logic. The question is not whether to offer them. It is whether the academic expectations inside them match what you require on your residential campus. If they do not, that is the standards problem worth fixing.
Funding Both Sides of the Mission
Budget decisions have real consequences for access. Research from the AEFP finance handbook shows that a 10% drop in state appropriations correlates with a 2% decrease in in-state undergraduate enrollment and a 4% drop in bachelor's degree completion, with the sharpest effects on Black and Hispanic students at funding-dependent institutions.
When resources are tight, the question leaders avoid is also the one they need to answer directly: do you cut research infrastructure or student support services? There is no universally right answer, but there is a process for getting to one.
A workable framework:
Trace the revenue contribution of each program and service area before cutting.
Identify what drives attrition in your student population. If students leave due to financial stress, cutting aid offices is self-defeating.
Separate one-time costs from structural ones so decisions do not embed long-term damage.
Be transparent with faculty and staff about trade-offs. Financial legibility builds institutional trust faster than almost anything else.
Making the Case to Skeptics
Alumni and board members who think access dilutes reputation are often working from a 30-year-old mental model of what makes a university credible. Your job as a leader is not to validate that model. It is to replace it with something better.
A few approaches that work:
Lead with outcomes data. Show retention rates, graduation rates, and post-graduation employment figures. Pair them against peer institutions. Let the numbers do the work.
Connect access to sustainability. With the enrollment cliff accelerating, an institution that cannot serve non-traditional students has a shrinking market. Inclusivity is a survival strategy, not just a values statement.
Tie it to mission. Most universities have founding documents that include some version of "serving the community." Use that language. Access is not a departure from mission. It usually is the mission.
Give donors a specific story. A graduate who completed a bridge program and moved into a career in public health is a more persuasive fundraising argument than a statistic about Pell Grant enrollment.
The Metrics That Actually Matter
Metric | What It Measures | Standards or Access Signal |
|---|---|---|
First-year retention rate | Early fit and support effectiveness | Both |
6-year graduation rate | Completion across student types | Access |
Post-graduation employment (1 yr) | Curriculum relevance and quality | Standards |
Grade distribution by course | Potential rigor erosion | Standards |
Faculty-to-student ratio | Instructional and advising capacity | Both |
Track these regularly, broken down by student income level, first-generation status, and transfer pathway, and you will have a clear picture of where your institution is succeeding and where the gaps are. That is the data that makes the access-and-standards conversation productive rather than ideological.
Where to Start
Pick one metric from the table above that your institution does not currently track by income or first-generation status. Start tracking it. That is the first move. Everything else follows from knowing what is actually happening to your students once they are in the door.
If you work with students whose credentials come from outside the U.S., accurate foreign credential evaluation is part of the same access infrastructure. Who you admit and how you assess them both matter.
 How Universities Use Zero-Waste Swap Programs to Cut Student Costs
 How Industry Partnerships Shape Modern Curricula
 How Post-COVID Aid Programs Help Universities Rebuild Admissions
 Beyond the Acceptance Rate and How Colleges Decide Who Gets In
 How Leveraging Job Placement Strategies Can Reenroll Returning Students